A tourist's city cyclability index
 Image by MichaelGaida from Pixbay
Whether you’ve managed to go on holiday during lockdown or just looking for a microadventure nearby, cycling is an excellent way to take advantage of the quieter roads and explore a city. Plus, it’s social-distancing friendly. Even when it’s quiet, road safety, weather and bike availability are still relevant matters to consider before embarking on a cycling adventure. Lockdown or not, I love seeing different cities by bike, but I also find myself concerned about road safety, weather, bike availability and whether or not it’s safe to park my bike. Having found this excellent cycling data from Coya, and inspired by their own index, I’ve decided to come up with my own city “cyclability” ranking system.
Using road safety, weather, bicycle rental facilities and road quality data, I ranked cities by means of a weighted average score with a strong emphasis on road safety. Specifically, the road safety component accounts for half of the score and is made up of two components - accident ratio and fatalities ratio.
You can lookup a city on the map below, which is illustrating the cities’ “cyclability” ranks:
And here’s the list ranked from the most “cyclable” cities to the least, if you want to see a the cities specific characteristics, such as the weather score or the number of bicycle shops:
| rank | city | country | weather | road_quality | accidents_per_100k | fatalities_per_100k |
|---|---|---|---|---|---|---|
| 1 | Munster | Germany | 58.74 | 53.05 | 445.58 | 0.53 |
| 2 | Utrecht | Netherlands | 63.83 | 60.78 | 279.88 | 1.94 |
| 3 | Malmo | Sweden | 58.98 | 52.40 | 433.11 | 0.37 |
| 4 | Copenhagen | Denmark | 61.19 | 61.60 | 218.44 | 1.04 |
| 5 | Hangzhou | China | 54.20 | 35.06 | 476.73 | 1.71 |
| 6 | Antwerp | Belgium | 62.67 | 53.37 | 1165.81 | 1.61 |
| 7 | Amsterdam | Netherlands | 63.42 | 61.71 | 1019.18 | 1.77 |
| 8 | Melbourne | Australia | 78.86 | 43.19 | 174.60 | 0.32 |
| 9 | Strasbourg | France | 61.26 | 58.82 | 267.57 | 0.63 |
| 10 | Bern | Switzerland | 53.27 | 65.46 | 482.36 | 0.69 |
| 11 | Hamburg | Germany | 58.26 | 54.90 | 263.80 | 0.34 |
| 12 | Bremen | Germany | 58.86 | 55.96 | 334.85 | 1.38 |
| 13 | Leipzig | Germany | 58.67 | 51.05 | 323.29 | 0.71 |
| 14 | Montreal | Canada | 49.60 | 44.12 | 986.47 | 0.42 |
| 15 | Berlin | Germany | 57.69 | 50.79 | 407.56 | 0.58 |
| 16 | Innsbruck | Austria | 55.14 | 56.18 | 1329.96 | 0.78 |
| 17 | Bordeaux | France | 67.14 | 59.40 | 305.14 | 0.72 |
| 18 | Frankfurt | Germany | 64.10 | 51.89 | 232.84 | 0.86 |
| 19 | Dusseldorf | Germany | 70.73 | 50.87 | 279.60 | 0.69 |
| 20 | Dresden | Germany | 57.38 | 54.27 | 403.51 | 0.39 |
| 21 | Cologne | Germany | 57.88 | 50.04 | 372.23 | 0.40 |
| 22 | Nuremberg | Germany | 60.73 | 52.95 | 310.97 | 0.83 |
| 23 | Bristol | United Kingdom | 69.85 | 56.17 | 1054.36 | 0.58 |
| 24 | Beijing | China | 58.74 | 32.11 | 384.95 | 1.14 |
| 25 | Sydney | Australia | 75.56 | 39.80 | 345.84 | 0.28 |
| 26 | Tel Aviv | Israel | 84.54 | 37.88 | 1067.21 | 0.48 |
| 27 | Bonn | Germany | 62.72 | 51.72 | 461.83 | 1.32 |
| 28 | Munich | Germany | 50.52 | 53.95 | 371.62 | 0.60 |
| 29 | Helsinki | Finland | 47.16 | 51.96 | 222.36 | 1.05 |
| 30 | Tokyo | Japan | 60.83 | 53.85 | 1220.14 | 1.44 |
| 31 | Wellington | New Zealand | 72.48 | 55.82 | 1188.31 | 0.52 |
| 32 | Nice | France | 83.56 | 55.04 | 389.41 | 0.92 |
| 33 | Shanghai | China | 59.01 | 32.75 | 309.92 | 1.13 |
| 34 | Hannover | Germany | 58.83 | 51.51 | 773.00 | 2.99 |
| 35 | Auckland | New Zealand | 74.64 | 38.83 | 453.72 | 0.25 |
| 36 | Nantes | France | 67.76 | 64.62 | 325.85 | 0.77 |
| 37 | Oslo | Norway | 47.45 | 38.58 | 226.40 | 0.53 |
| 38 | Ljubljana | Slovenia | 46.05 | 34.75 | 840.20 | 1.43 |
| 39 | Dortmund | Germany | 63.96 | 48.71 | 147.85 | 0.39 |
| 40 | Vancouver | Canada | 65.09 | 51.09 | 1455.97 | 0.44 |
| 41 | Geneva | Switzerland | 56.48 | 66.49 | 623.47 | 0.95 |
| 42 | Seville | Spain | 70.41 | 52.18 | 1142.89 | 0.89 |
| 43 | Portland | United States | 71.32 | 61.96 | 1692.47 | 0.96 |
| 44 | Stuttgart | Germany | 56.34 | 49.25 | 153.26 | 0.00 |
| 45 | Madrid | Spain | 68.34 | 46.60 | 1104.19 | 0.61 |
| 46 | Vienna | Austria | 69.29 | 53.44 | 1015.93 | 1.58 |
| 47 | Milan | Italy | 53.92 | 35.26 | 1542.70 | 1.16 |
| 48 | Sao Paulo | Brazil | 66.93 | 12.04 | 475.44 | 1.71 |
| 49 | Washington | United States | 60.97 | 48.32 | 1699.01 | 0.57 |
| 50 | Paris | France | 66.31 | 58.51 | 318.14 | 0.75 |
| 51 | Casablanca | Morocco | 89.45 | 21.30 | 995.83 | 4.13 |
| 52 | San Francisco | United States | 88.58 | 56.12 | 2586.71 | 0.56 |
| 53 | Cairo | Egypt | 77.58 | 18.35 | 1929.06 | 0.47 |
| 54 | Dublin | Ireland | 68.72 | 43.56 | 517.05 | 0.63 |
| 55 | Seattle | United States | 71.92 | 56.73 | 1688.20 | 0.67 |
| 56 | Warsaw | Poland | 49.50 | 29.50 | 345.40 | 2.39 |
| 57 | New Delhi | India | 52.24 | 23.38 | 441.42 | 1.08 |
| 58 | Reykjavik | Iceland | 46.55 | 61.99 | 593.25 | 0.50 |
| 59 | Santiago | Chile | 81.05 | 34.34 | 362.72 | 2.51 |
| 60 | Barcelona | Spain | 83.04 | 54.15 | 1796.71 | 0.50 |
| 61 | Edinburgh | United Kingdom | 62.56 | 52.85 | 1175.78 | 0.95 |
| 62 | Bogota | Colombia | 70.16 | 17.30 | 567.44 | 3.21 |
| 63 | Cali | Colombia | 74.26 | 13.07 | 622.11 | 3.69 |
| 64 | Brussels | Belgium | 63.34 | 40.75 | 1060.01 | 1.84 |
| 65 | Moscow | Russia | 45.49 | 13.84 | 693.27 | 1.26 |
| 66 | Boston | United States | 59.44 | 54.20 | 3459.77 | 0.49 |
| 67 | Athens | Greece | 82.73 | 32.47 | 571.98 | 0.75 |
| 68 | London | United Kingdom | 64.69 | 42.61 | 1299.08 | 0.68 |
| 69 | Nairobi | Kenya | 78.59 | 24.10 | 459.97 | 1.13 |
| 70 | Chicago | United States | 56.68 | 49.65 | 2197.60 | 0.62 |
| 71 | Jakarta | Indonesia | 31.92 | 21.24 | 428.31 | 0.97 |
| 72 | Seoul | South Korea | 57.64 | 43.62 | 341.99 | 2.37 |
| 73 | Los Angeles | United States | 89.82 | 50.65 | 2148.35 | 0.85 |
| 74 | New York | United States | 60.75 | 48.20 | 2157.77 | 0.66 |
| 75 | Krakow | Poland | 50.24 | 33.39 | 312.40 | 2.16 |
| 76 | Buenos Aires | Argentina | 72.86 | 16.94 | 835.41 | 0.83 |
| 77 | Detroit | United States | 57.38 | 55.79 | 858.76 | 0.91 |
| 78 | Lisbon | Portugal | 81.33 | 44.94 | 1947.91 | 1.76 |
| 79 | Singapore | Singapore | 58.32 | 56.79 | 339.25 | 2.35 |
| 80 | Stockholm | Sweden | 51.40 | 51.97 | 366.39 | 0.56 |
| 81 | Rome | Italy | 77.83 | 34.17 | 1003.01 | 1.41 |
| 82 | Johannesburg | South Africa | 85.48 | 57.11 | 349.85 | 7.43 |
| 83 | Prague | Czech Republic | 55.80 | 37.34 | 838.27 | 1.74 |
| 84 | Medellin | Colombia | 76.22 | 9.27 | 1098.53 | 3.99 |
| 85 | Istanbul | Turkey | 75.00 | 31.71 | 1837.11 | 0.41 |
| 86 | Hong Kong | SAR China | 50.13 | 34.89 | 1117.99 | 1.19 |
| 87 | Bangkok | Thailand | 23.62 | 24.75 | 554.42 | 3.29 |
| 88 | Lagos | Nigeria | 29.24 | 1.43 | 525.48 | 2.97 |
| 89 | Mexico City | Mexico | 80.54 | 23.45 | 411.56 | 0.65 |
| 90 | Tbilisi | Georgia | 64.45 | 14.85 | 2272.83 | 0.76 |
You can also download the file containing all the data used as a CSV:
If you’d like to explore the methodology, you can carry on reading below. Happy cycling! :)
Methodology
The data
The data gathered by Coya is made up of 20 variables.The full list of variables, data collection methodology and variable definitions can be accessed here. For the purpose of developing this ranking system, I made use of the following variables:
city,country: Self explanatory.weather: Aggregated whether score ranging from 1 to 100. The higher the better the weather is for cycling.fatalities_per_100k: Deaths per 100k cyclists.accidents_per_100k: Accidents that resulted in at least light injuries per 100k cyclists.bicycle_theft_score: Stolen bicycles per 100 k cyclists, weighed for high crime rates (to compensate for low reporting rates).specialised_roads_and_road_qual_score: Cycling road length per number inhabitants.number_bike_sharing_and_rental_stations_per_100k: “An estimate of bicycle sharing and rental stations per 100,000 of population.”percent_bicycle_usage: “Percentage of people using bicycles in everyday life in each city.”
Ranking System
(Road) Safety First
There are two ways of looking at road safety - how likely one is to be involved in an accident, and how likely one is to be involved in a fatal accident. The difference is somewhat subtle. Having congested (cycling) roads might increase the chances of an accident resulting in light to minor injuries, for example. Cycling in a city where motorists are not used to cyclists, on the other hand, might not necessarily increase the chance of being involved in an accident but, a collision with an inattentive car driver, for example, would increase the chances of being involved in a fatal accident.
This negative relationship is shown in the plot below, which illustrates that as the number of accidents per 100k cyclists increases, the number of fatalities decreases. The trend line also suggests that the safest cities tend to have an accident ratio of about 1500.
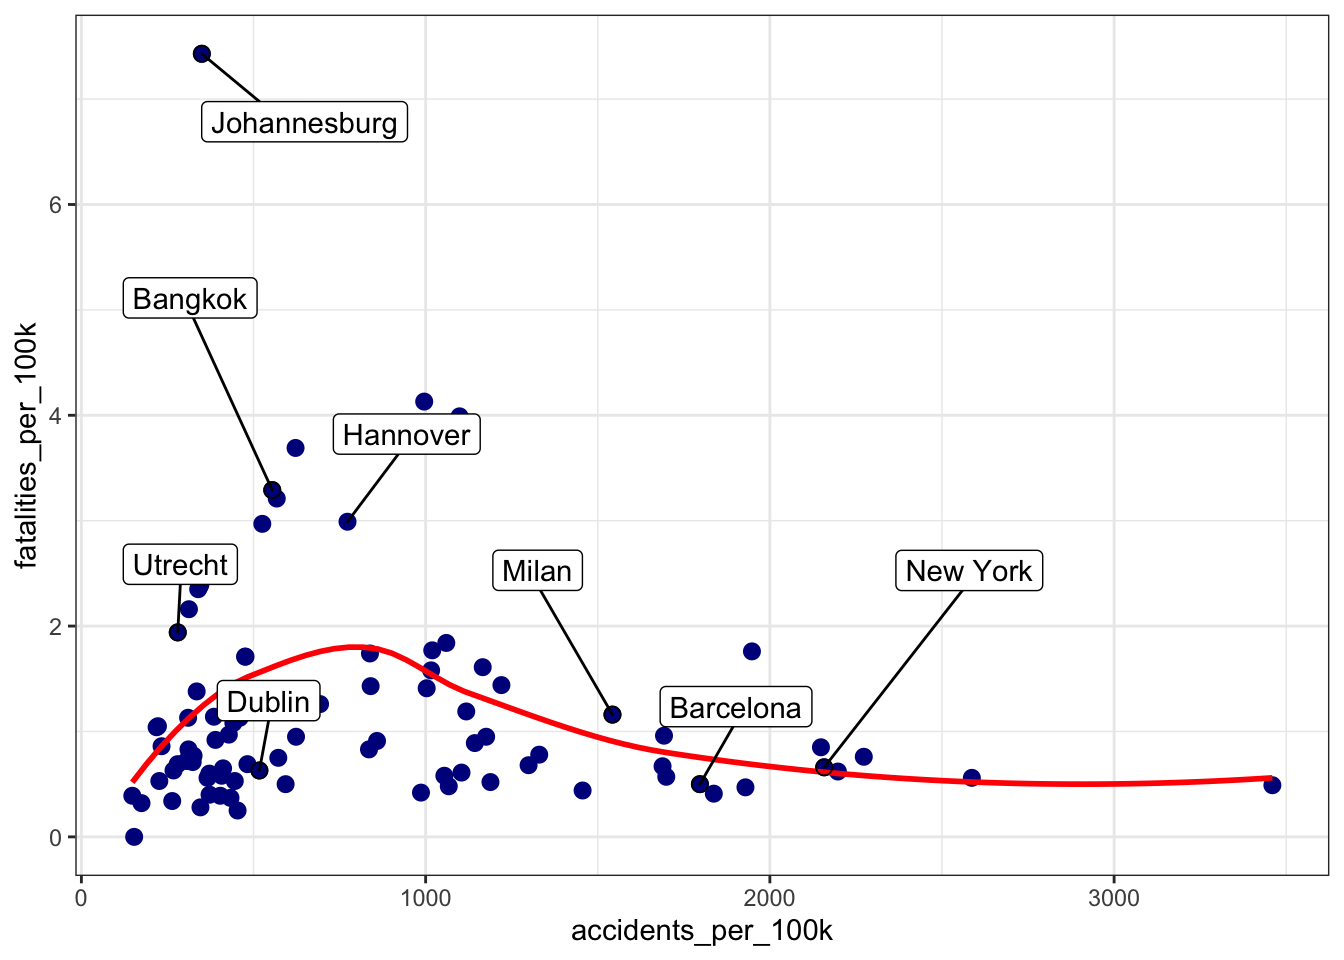
So I’d consider the fatalities ratio rather than the accidents ratio, when assessing a cycling destination’s road safety.
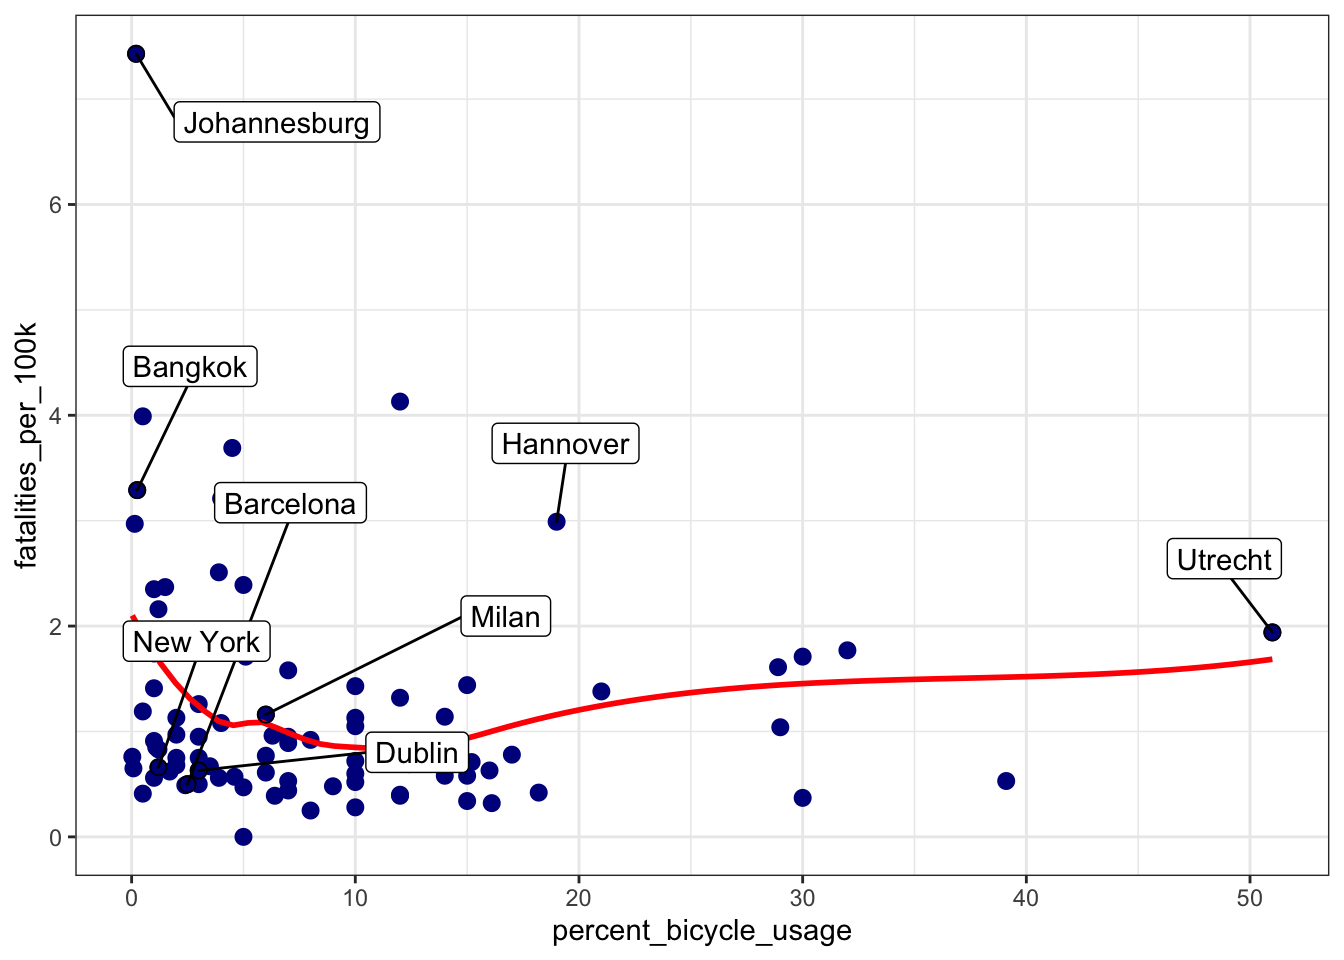
Another consideration that needs to be made with regards to safety is that the bicycle-related fatality rate is related to the bicycle usage in everyday life. In the Netherlands, for example, the fatality rate is high amongst the elderly. While this in itself is problematic in that everyone should be safe to cycle, the high fatality rate also highlights the fact that the elderly do feel safe to cycle.
I also happen to know that the road accident and fatality rates in Johannesburg are high overall. This is reflected in the high bicycle-related fatality rate in Johannesburg, but also, perhaps, by the low percentage of the population who uses bikes on a daily basis.
In other words, in cities where it is relatively safe to cycle, more people - young and old, skilled or less skilled - feel safe enough to cycle through the cities. The wide variety of people, in turn, can lead to more fatalities. Under these circumstances, however, the increase in fatalities reflects the fact that population at wide feels safe enough to cycle rather than that the roads are really dangerous for cyclists.
I illustrate this in the plot below, where the percentage of people cycling in everyday life is plotted against the bicycle-related fatality rate. The plot illustrates that, in the cities where everyday cycling is uncommon, the fatality rate tends to be high. As everyday life cycling become more popular, the fatality rate tends to decrease. However, as even more people start using the bikes, the fatality rate increases slightly.
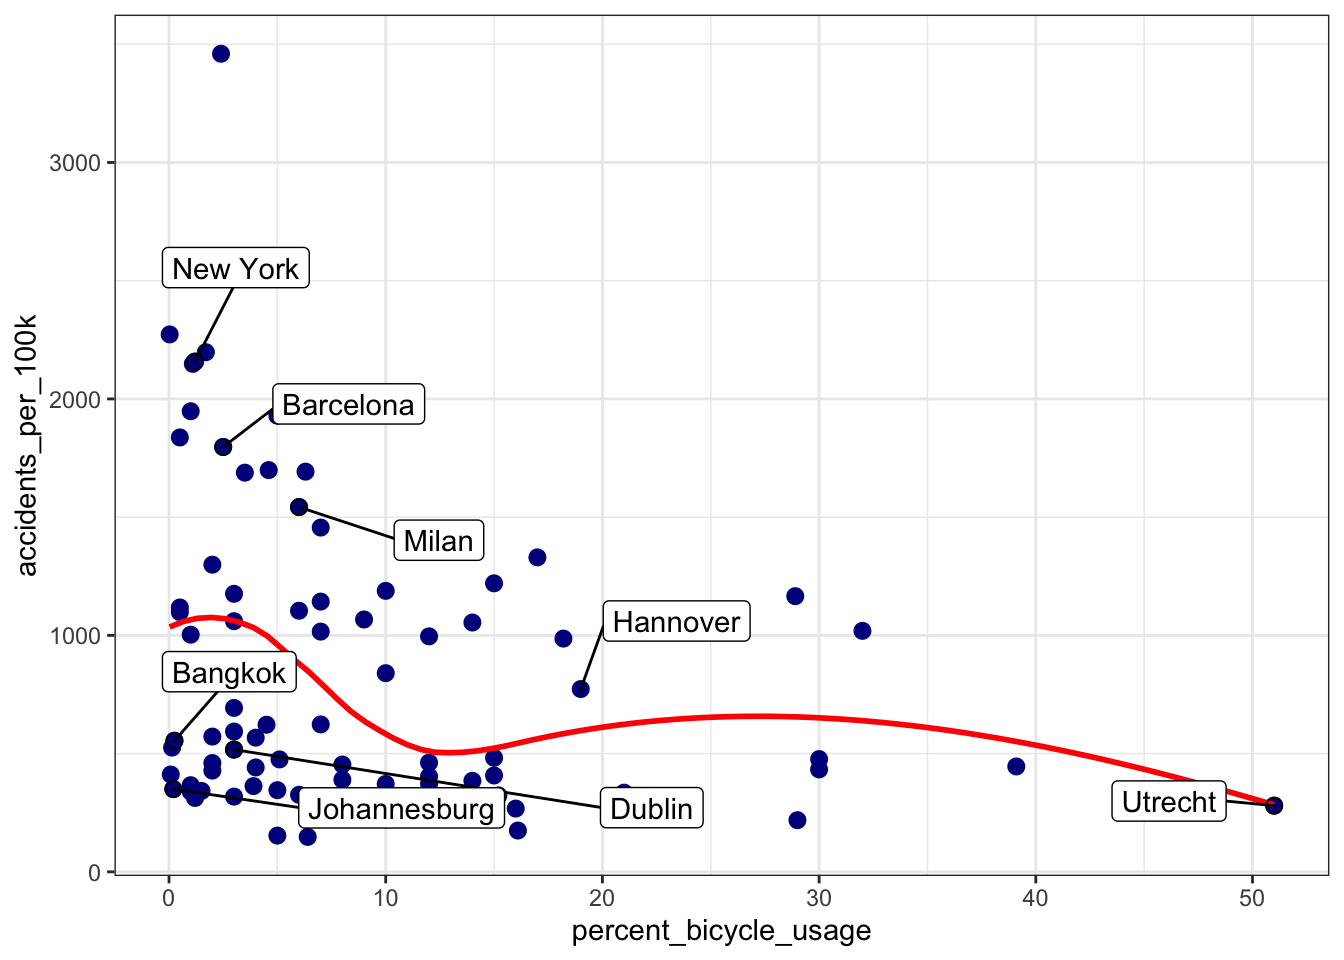
Note that a similar relationship seems to be emerging when contrasting the bicycle usage with the accident rate.
Now, I am not claiming that this “U-shaped” characteristic is necessarily due to vulnerable populations (such as the elderly) taking to the roads. It is also plausible, for example, that as more people take to the roads, the roads become more congested leading to more accidents. Even if that were the case, since the scoring system already (heavily) penalises high-fatality-rate cities, the percentage of people using bicycles in everyday life should be incorporated into the ranking system. Additionally, by penalising the cities where cycling is not common in everyday life, the scoring system implicitly penalises the lack of evidence. In other words, I don’t trust trust the numbers if a small percentage of the population cycles.
Before generating a safety score, I min-max normalise the fatalities and accidents data so that they take a value between 0 and 1:
# min-max rescale fatality and accident rate
bikes <- bikes %>%
            mutate(fatalities_per_100k_norm = rescale(fatalities_per_100k),
                   accidents_per_100k_norm = rescale(accidents_per_100k))
To take both safety variables into consideration, I’ve created a weighted safety score whereby the normalized fatality rate counts three times as much as the normalized accident rate, as follows:
\[ safety\_score = \begin{align*} &log(percent\_bicycle\_usage)* \\ \\ &\left[1-\frac{(3*fatalities\_per\_100k\_norm + {accidents\_per\_100k\_norm})}4\right]\end{align*} \]
This way, cities with high accident rates are also penalised, though three times less than cities which have a high fatality rate. To penalise cities where few people use bicycles on an everyday basis, note that I multiplied this weighted average with the log of percent_bicycle_usage.
# calculate vulnerability score
bikes <- bikes %>%

    mutate(vulnerability_score = (3*fatalities_per_100k_norm + # weighted average - fatalities 3x more important
                                    accidents_per_100k_norm
                                    )/4,

           safety_score = log(percent_bicycle_usage) * # penalty for low everyday bicycle usage
                            (1 - vulnerability_score) # inverse of vulnerability score - aka safety

           )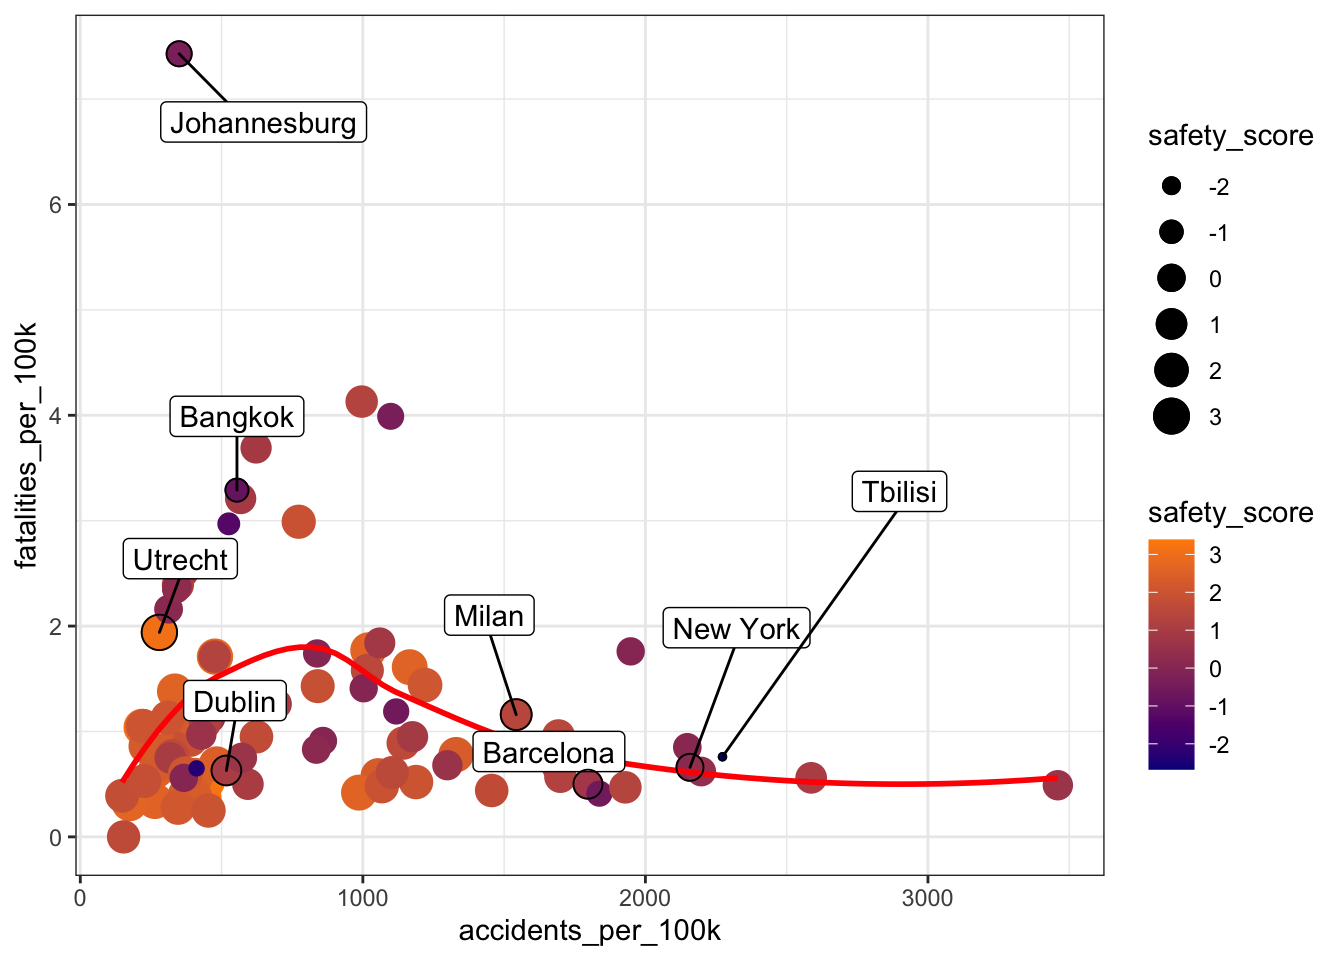
As the plot above illustrates, the safety score is very low for cities with a high fatality rate, and moderate for cities with high accident rates but low fatality rates. Note that, in spite of low fatality and accident rates, for cities where few people cycle in their everyday life (such as Tbilisi) the safety score is low.
Weather, bicycle theft, bike-sharing and road facilities.
Provided it’s relatively safe to cycle, I’d prefer riding in good whether, find bicycles easily and not worry about them being stolen. I also find it easier when there are dedicated cycle lanes and proper signs - especially in a new city! So I’ve min-max scaled and averaged the weather, number_bike_sharing_and_rental_stations_per_100k, the inverse of bicycle_theft_score, and the specialised_roads_and_road_qual_score to compose an other_factors score.
\[ other\_factors = \left[ \begin{align*} &weather\_norm + \\ &number\_bike\_sharing\_and\_rental\_stations\_per\_100k + \\ &(1 - bicycle\_theft\_score\_norm) + \\ &road\_quality\_norm\end{align*}\right]/4 \]
Then, I’ve averaged the safety_score with the other_factors score into a final_score, as follows:
\[ final\_score = (safety\_score + other\_factors)/2 \]
Code below:
# calculate other factors and generate a final score variable
bikes <- bikes %>%
            mutate(other_factors = (rescale(weather) +
                                    rescale(number_bike_sharing_and_rental_stations_per_100k) +
                                    (1-rescale(bicycle_theft_score)) +
                                    rescale(specialised_roads_and_road_qual_score)
                                    )/4,
                   final_score = (safety_score + other_factors)/2
                   ) %>%
            arrange(desc(final_score)) %>%
            mutate(rank = 1:nrow(bikes))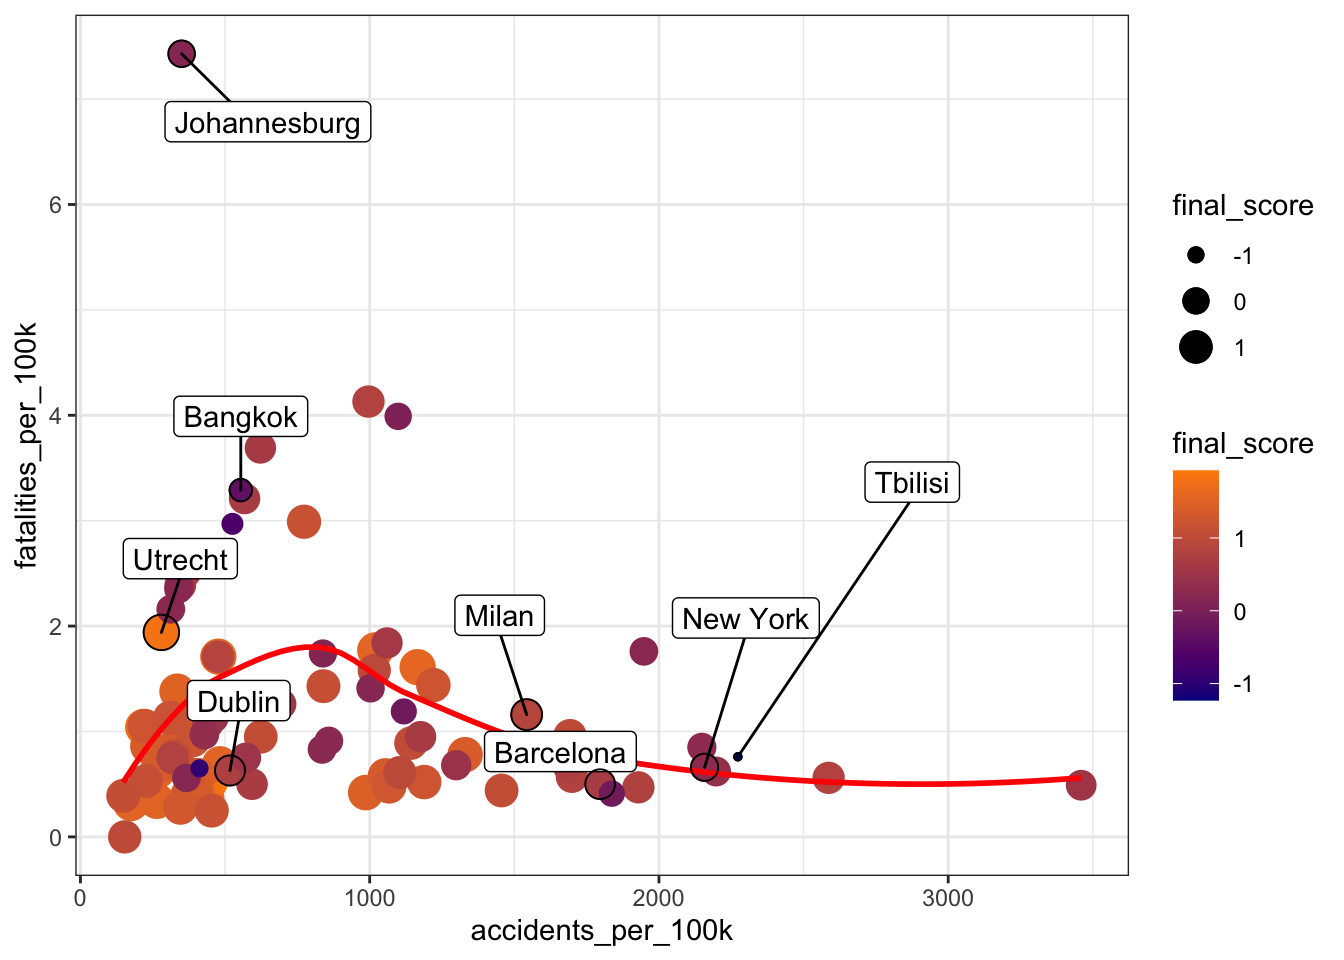
There we have it. A city “cyclability” score which prioritises road safety and takes weather and bicycle rental/sharing facilities into consideration. Fun and safe cycling, here we come! :)
Dragos Tomescu
Data Trainer (previously, Data Analyst)
A data analytics professional with a passion for understanding society. I write about data-driven applications and their impact on business and society.